
The Last Triad Periods Explained
The National Grid recently announced the official triad dates for winter 2022/2023 and there’s something interesting going on. Not only are they the last triads as we know them, but they are the lowest overall demand for any winters triad settlement periods in history, with two of the three settlement periods being the lowest two periods of all the historic data going all the way back to 2008, based on National Grid data. This article looks at this winter’s triad settlement periods in more detail and explains the factors that have influenced them.
As a reminder, the triad settlement periods for 2022/2023 were:
2nd December 2022, 17:30 pm – 39,581 MW
15th December 2022, 17:00 pm – 44,561 MW
17th January 2023, 17:00 pm – 42,030 MW
Are they really that low?
From the chart below, you can see where this years peaks are compared to other periods. The lowest peak was the lowest demand ever by around 7.5%, the middle peak was the 2nd lowest ever and all three settlement periods are in the bottom 20th percentile going back to 2008.

What’s so special about this year?
To understand how the settlement periods have been chosen this year, we need to follow the logic used by the ESO. The below graph shows the 4pm to 7pm weekday consumption data, from November 2022 to February 2023.

November’s consumption was notably low because of the mild weather. The consumption then increased in December before dropping during the festive season (nothing new to see here). In January, consumption picked up again when businesses reopened, but it flattened out in February due to, once again, fairly mild weather for that time of year.
So, first things first, let’s pick out the first peak – 15th December 2022, 17:00 pm – 44,561MW. This is shown by the green triangle on the graph below, and then the green ten-day exclusion zone either side of the peak.

You can see that the exclusion zone eliminates a number of other settlement periods which all sit above 45,000. In fact, you have to go to the 22nd highest demand period of the winter to find our second peak, identified as the 17th January 2023, 17:00 – 42,030MW.

This peak (blue triangle on the graph above) occurred a few weeks after businesses had reopened following the festive break, which meant that the blue exclusion zone eliminated a number of other peaks during the middle of January where demand was consistently higher than the seasonal norm.
This made the hunt for the 3rd settlement period a real challenge and the ESO had to go all the way down to the 200th highest period of winter to find the final triad period which was the 2nd December 2022, 17:30 pm – 39,581MW.

This was the lowest single triad settlement period in history. As the graph above shows, this period sits just outside of the exclusion zone of the first triad peak, and from the purple triad 3 demand line it becomes clear just how many periods sat above this line but in the exclusion zones of peaks 1 & 2.
So what does all this mean?
Well, in theory, lower demand across those settlement periods would mean reduced income for system operators to maintain the transmission network. After all, total demand is 3% less than the previous winter and nearly 12% down on 5 years ago in 2017/18.
But, in reality, the average £/kWh charged for triad settlement periods this winter were around 7% up on last winter and around 20% higher than they were 5 years ago. This means that the income generated from triads has remained relatively stable for the last 7 years.
Businesses will have certainly benefited from the low demand periods (provided they didn’t buck the trend) and this might go some way to offset the increased TNUoS unit rates this winter, but they should be keeping a close eye on bills during April, May, and June to make sure those reconciliations are applied correctly in order to protect cashflow.
Get in touch with one of our experts to make sure you are being charged correctly.
Connect with us
Want more insights like this? Sign up for EnergyIntels and stay informed with the latest industry updates.
More From EnergyIntel

How One Manufacturer Turned Energy Into a Board-Level KPI
EMaaS in Action: How One Manufacturer Turned Energy Into a Board-Level KPI Every manufacturer knows energy is a significant operational cost, but understanding where it's really being used [...]
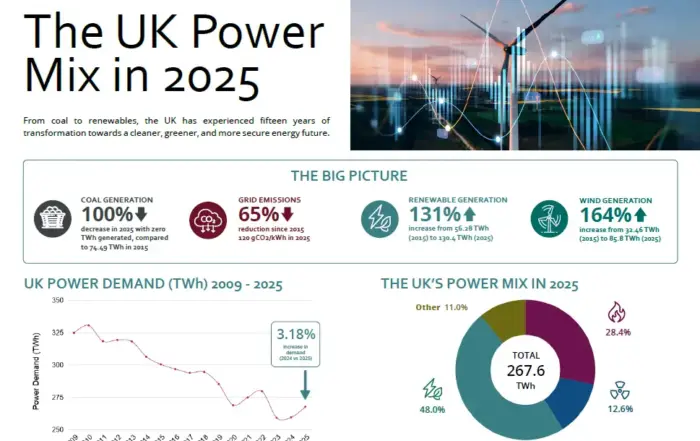
UK Power Generation Mix in 2025
The UK Power Mix in 2025 How the UK’s electricity system has been transformed Over the past 15 years, the UK electricity system has undergone one of the fastest [...]

Technical Energy Cost Structures and Their Impact on Energy Strategy
How Technical Energy Cost Structures Are Redefining Energy Strategy When boards turn their attention to energy, the conversation almost always begins in the same [...]